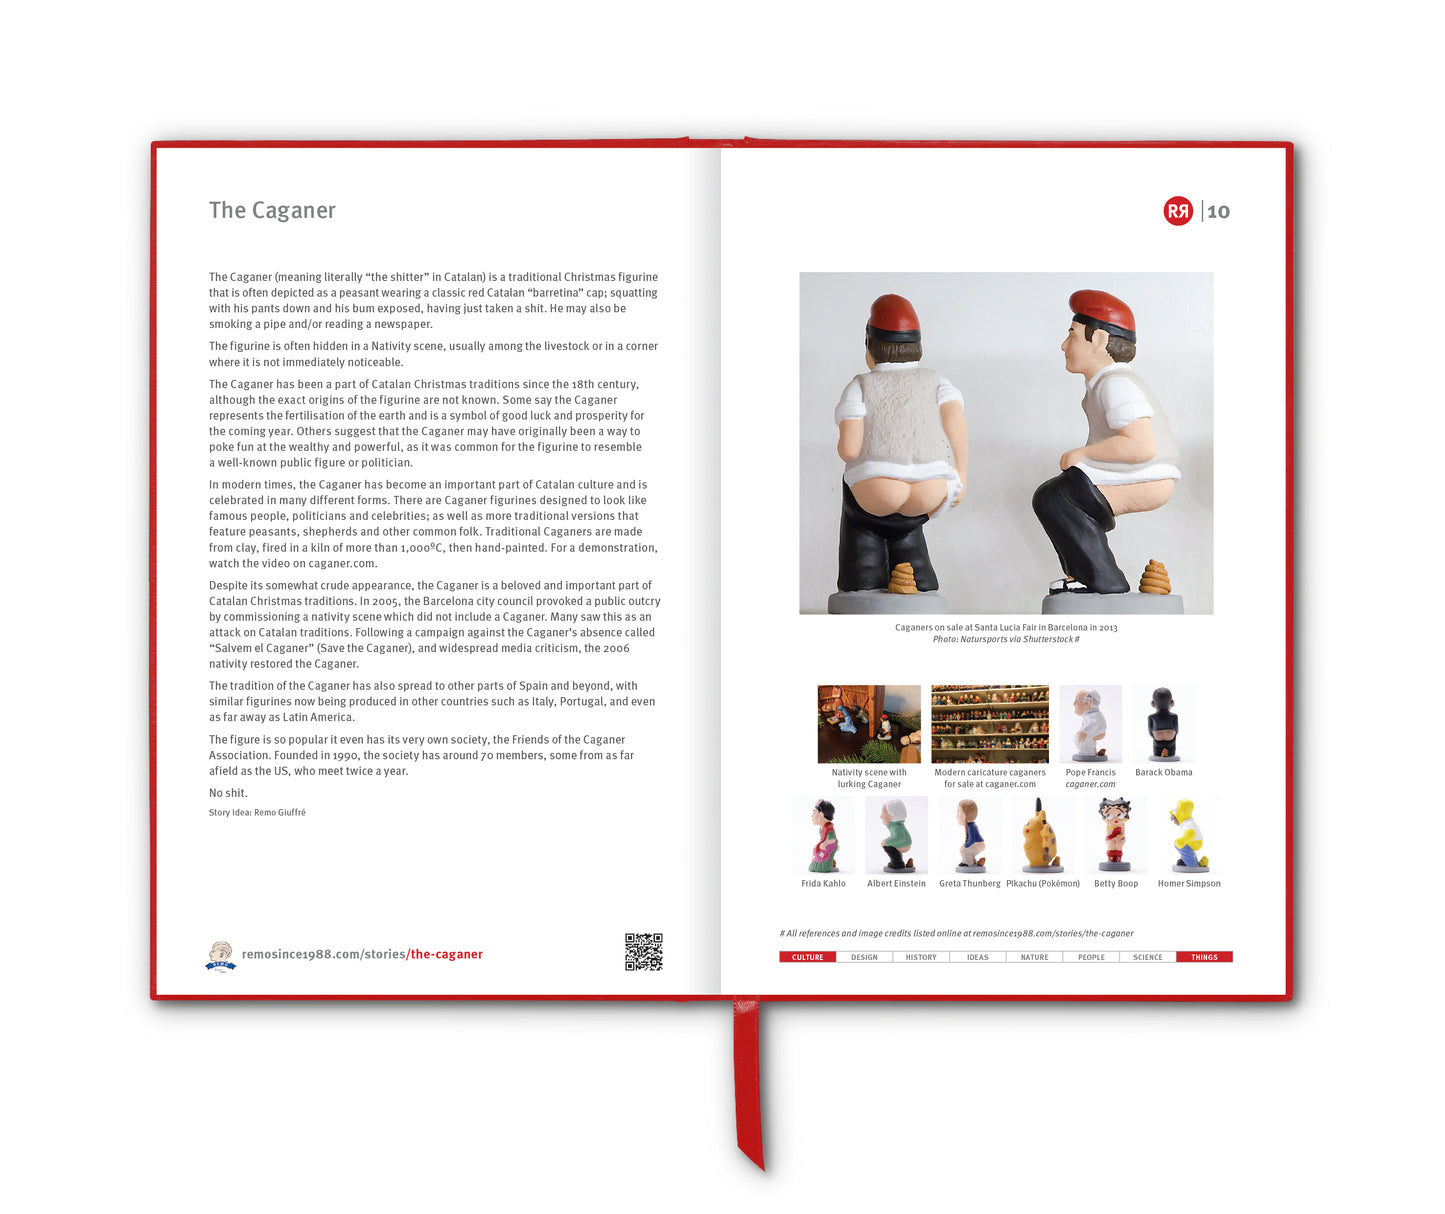

The most popular poster in history has nothing to so with The Beatles, Taylor Swift … or Einstein sticking out his tongue. It’s the one that that you see on the wall of your optometrist.
The Snellen chart is a widely used tool for measuring visual acuity, developed by the Dutch ophthalmologist Herman Snellen in 1862. It features rows of letters that progressively decrease in size.
Before Snellen, there was no standardised way to measure vision. Early attempts involved reading texts or recognising objects at a distance, but these methods were inconsistent. Working with his mentor Frans Cornelis Donders, Snellen designed a chart that used letter optotypes – specifically shaped letters constructed with consistent proportions. His goal was to create a quantifiable and repeatable method for measuring visual acuity.
The original Snellen chart had large letters at the top, decreasing in size with each row. It was designed to be read at a standardised test distance, usually 6 metres (20 feet). The chart introduced a scoring system based on a fraction, such as 20/20 vision, meaning a person can read at 20 feet what a normal eye should be able to read at that distance, i.e. letters that subtend 5 minutes of arc.
The standard eye chart consists of nine different letters: C, D, E, F, L, O, P, T and Z. Snellen selected these Roman letters as they were part of the Dutch language symbology. However, Snellen charts have been translated into dozens of different languages so the letters/characters match the patient’s native language.
Snellen accounted for illiteracy by creating a “The Tumbling E” chart. That version of the Snellen chart maintained the same level of geometric consistency but only had a series of letter Es positioned in different directions. This chart worked perfectly because the letter E could be replicated by a person holding three fingers (index, middle and ring finger). So, as they looked at the charts, first with one eye covered – then the other eye covered – and then with both eyes open – patients used their three fingers to demonstrate the orientation of the letter E. (The Landoldt C chart uses the same idea as the tumbling E, but using the patient’s cupped hand to recreate a C.)
While other eye exam charts were used by optometrists and ophthalmologists around the western world, none of them were considered a “standard.” A standardised chart was revolutionary because it allowed people to have their visual acuity tested in any office that had the chart with the same results and prescription.
There are also Snellen-like charts that use symbols rather than letters. Historically, symbols were intentionally selected to represent common everyday objects, like a house, tree, flower, umbrella, bird, etc. This made it easier for patients to identify what’s what. Today, we use a standardised version called the LEA symbols chart, which uses a square, house, apple and circle.
While the Snellen chart’s basic premise continues to be the optometric and ophthalmologic standard, other notable visual acuity charts are also used, e.g. the Bailey-Lovie eye chart is the revamped version of the Snellen chart most widely used in doctor and optometrist offices today.
Even with advances in technology, the Snellen chart remains a fundamental tool in ophthalmology and optometry. While newer methods (like computerised vision tests) have supplemented it, Snellen’s original concept still underpins how we assess vision today.
Story Idea: Melanie Giuffré
___________________________
References
wikipedia.org/wiki/Snellen_chart
drrohitvarma.wordpress.com/2018/05/14/seven-fascinating-facts-about-the-development-of-the-eye-chart
atlanticeyeinstitute.com/history-of-the-eye-chart
roche.com/stories/measuring-vision-snellen-chart-in-ophthalmology
Images
1. Herman Snellen with his eye chart
2. 20/20 vision
3. Tumbling E and Landoldt C charts
4. LEA symbols chart
5. Russian language Snelling chart
6. Optometrist holding optometry glasses and chart
7. Ian Bailey and Jan Lovie photographed in 2014
8. Credit: wolfeeyeclinic.com
9. Photograph of Einstein taken by Arthur Sasse in 1951